Indonesia’s US$10.61 Billion Trade Surplus: Key Drivers
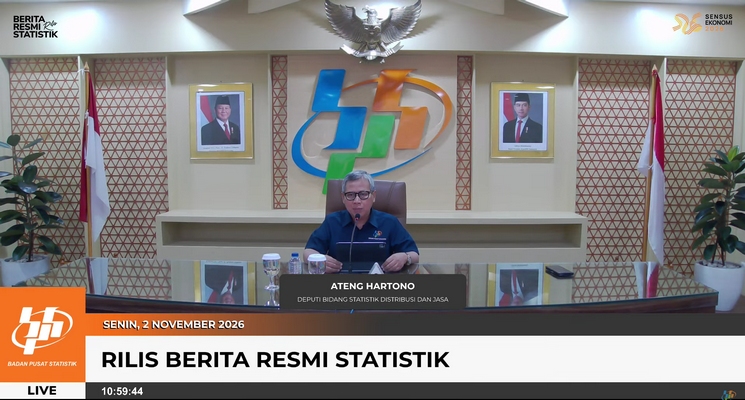
JAKARTA, JakartaWeekly.com—Statistics Indonesia (BPS) reported that Indonesia recorded a cumulative trade surplus of US$10.61 billion in January–September 2026, supported by a surplus of US$3.36 billion in September 2026.
Ateng Hartono, Deputy for Distribution and Services Statistics at BPS, said the surplus for the January–September 2026 period was driven by non-oil and gas trade, which recorded a surplus of US$34.21 billion.
“Meanwhile, trade in oil and gas commodities continued to post a deficit of US$23.60 billion,” Ateng said in Jakarta recently.
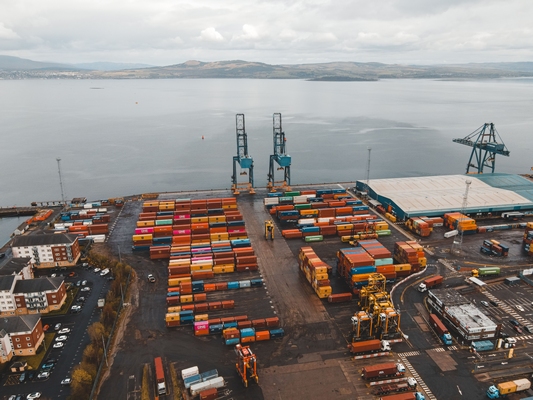
He said cumulative exports in January–September 2026 reached US$221.23 billion, up 5.58% from the same period a year earlier. The increase was mainly driven by non-oil and gas exports, which grew 6.30% to US$212.27 billion.
By sector, manufacturing recorded the highest export value, reaching US$182.83 billion, up 8.93% from the same period in 2025.
Indonesia’s three largest non-oil and gas export destinations were China, with US$54.17 billion (25.52%); the United States, with US$25.39 billion (11.96%); and India, with US$15.00 billion (7.07%).
Meanwhile, cumulative imports in January–September 2026 reached US$210.63 billion, up 19.67% from the same period a year earlier. The increase came from non-oil and gas imports, which rose 16.92% to US$178.06 billion, and oil and gas imports, which climbed 37.35% to US$32.57 billion.
By end use, Indonesia’s imports were dominated by raw and auxiliary materials, valued at US$150.57 billion, up 21.11%. Imports of capital goods reached US$41.55 billion, an increase of 16.49%, while consumer goods imports stood at US$18.51 billion, up 15.54%.
China remained Indonesia’s largest source of non-oil and gas imports in January–September 2026, with a value of US$76.16 billion (42.77%). Japan ranked second at US$10.04 billion (5.64%), followed by Australia at US$8.07 billion (4.53%).
Meanwhile, the non-oil and gas trade surplus in January–September 2026 was mainly contributed by several key commodities: animal and vegetable fats and oils, at US$29.31 billion; mineral fuels, at US$21.42 billion; iron and steel, at US$13.95 billion; nickel and articles thereof, at US$9.52 billion; and footwear, at US$4.86 billion.
Discover more